
Developing Yield curves and how the latest nexRates pricing technology simplifies the life of a trader.
Yield curves play a fundamental role in fixed income trading, where building curves allows traders to represent the term structure of the cost of debt for an issuer or country.
Given the nature of the curve source values, yield curves are discrete, and the curve granularity depends on two drivers:
- How many sources (bonds or swaps) are available for the specific country or issuer.
- How many curve points the user decides to include as benchmarks when building the curve.
While the first driver is an objective value, the second driver depends on a number of factors. These factors can include the liquidity/reliability of the possible curve benchmarks, the decision to adhere to market standards rather than personalize the analytics, the trade-off between curve density and the need to roll the benchmarks every time it’s appropriate.
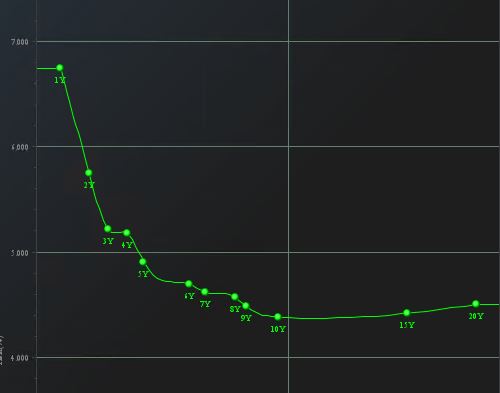
Whatever the granularity of the curve, its unavoidably discrete nature leads to the necessity of interpolation in order to infer the cost of debt for all the possible future maturities, often used by credit bond traders as the reference for pricing purposes. More often than not, the maturity of the credit bond to be evaluated falls in between the maturity of two curve benchmarks.
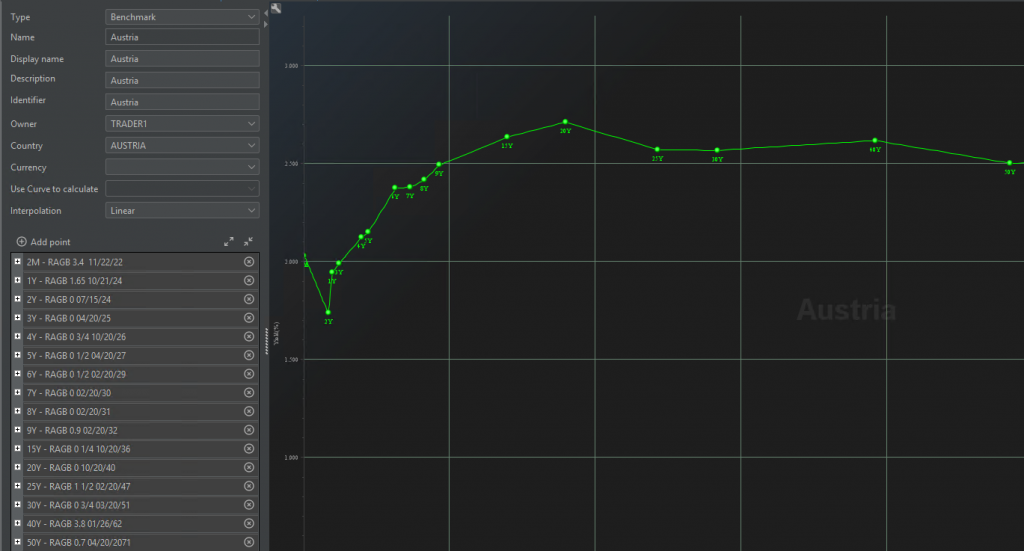
Basic linear interpolation, even if widely used, may not guarantee a reliable evaluation of the cost of debt for the entire curve length, resulting in possible mispricing of bonds whose yield and price are linked to that curve.
For example, a temporary squeeze of a single curve benchmark makes the curve interpolation around that maturity likely not reflect the actual cost of debt the street assigns to the specific issuer or country. This event is less probable for very liquid benchmarks, but could occur when, for making the curve denser, users add to the curve structure less liquid benchmarks, or when the issuer does not have a sufficient amount of liquid issues.
There is clearly a need for more sophisticated curve building to provide better pricing:
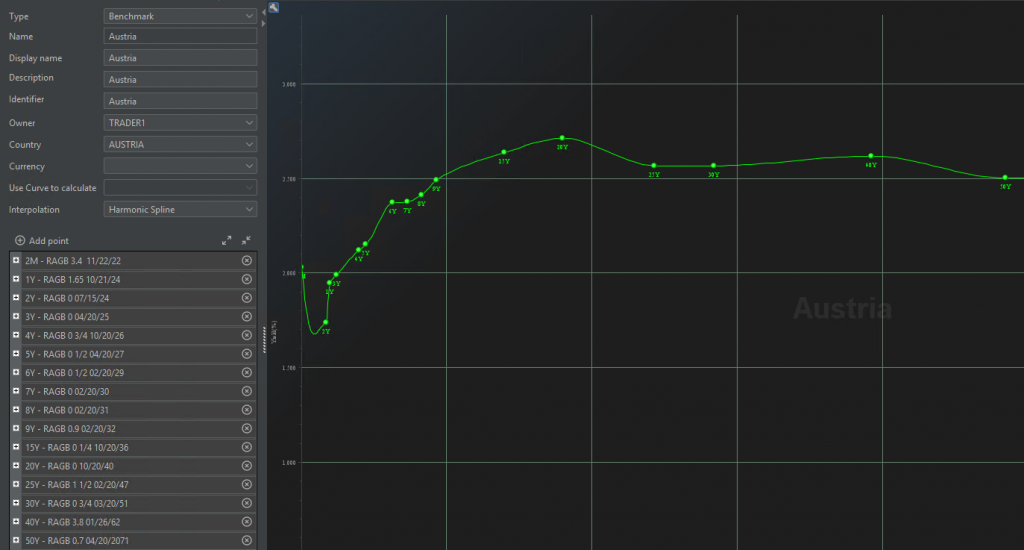
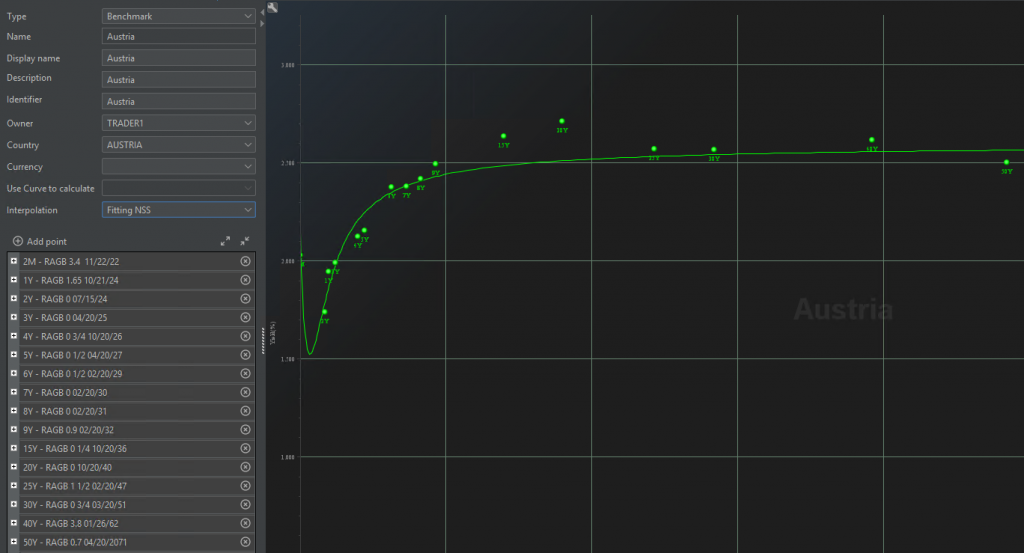
Below are some sample interpolations and fitting, applied to the same benchmarks (in this case, the Austrian Government).
This intrinsic limitation of linear interpolation of yield curves along with the high volatility of bond markets in this historical period led to high demand from the market for more sophisticated ways of managing yield curves, in order to facilitate correct pricing for instruments linked to that curve and proper investment decisions.
nexRates supports sophisticated interpolation and fitting
For this purpose, nexRates provides the possibility to set non-linear interpolations for each yield curve traders want to build on our platform. Not only can the interpolation methodology be chosen when the curve is built, but users can change it even at runtime with an immediate effect when curve edit is committed.
Supported by a well-established financial library, you can choose amongst a wide range of non-linear interpolation types, we can group into two main categories: flat (backward and forward) and splines (cubic, log-cubic, monotonic-cubic…).
Interpolation methodologies, regardless of being linear or non-linear, the “by-definition” constraint that the shape derived by the interpolation must pass through each of the curve benchmarks. Therefore, in case of anomalous pricing of one of the benchmarks, even if the more sophisticated non-linear interpolations can smooth the impact of that odd price, the yield at maturities close to that benchmark must in turn be close to its yield, even if it does not represent realistically the cost of debt of the related issuer/country around that tenor.
An alternative methodology provided by nexRates for coping with discrete yield curves and building a continuous shape not constrained by benchmark yields is the so-called “curve fitting”, or “curve smoothing”: by definition, it’s the process of specifying the model that provides the best fit to the specific discrete available inputs.
Notable amongst the diverse fitting methodologies is the Nelson-Siegel nexRates pricing engine , both in the original version developed by Nelson and Siegel (NS), and in the extended one coded by Svensson (NSS), especially the first one widely used by central banks and policy makers for proper estimation of the term structure of interest rates.
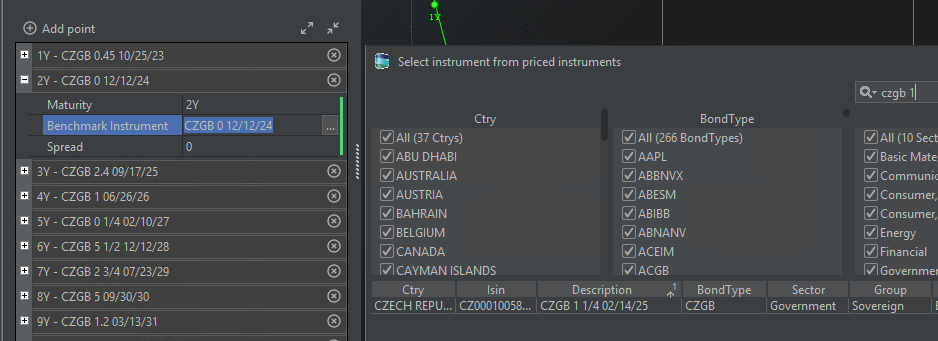
Regardless of the interpolation of fitting methodology chosen for each specific curve, nexRates provides users with a comprehensive and easy framework for managing curve editing, both for adding and rolling benchmarks. Users can either explicitly add/change points from the dedicated curve wizard or drag and drop available from the diverse nexRates Console grids manually.
You can exploit nexRates curves for a multiplicity of scopes:
- yields and curve shape visualization
- pricing of business-related bonds
- risk/cheap analysis of bonds compared to the specific curve
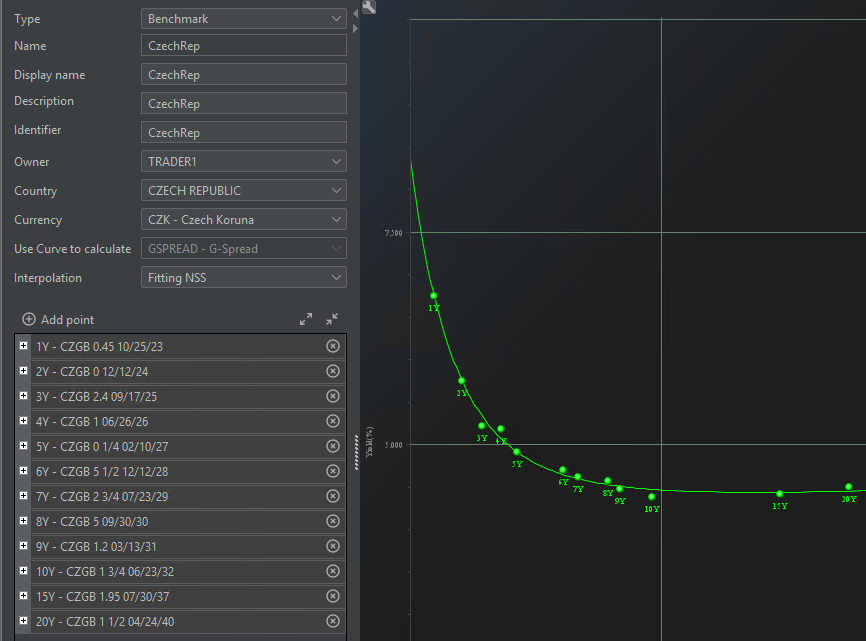
- G-Spread
You can fine-tune all these business valuable opportunities by choosing the interpolation or fitting you think best suits the specific issuer and/or market conditions. nexRates provides traders and quants with more than 10 different interpolations/fittings. If you want to know more, please email/DM me via LinkedIn (andrea.palermo@softsolutions.it)